
08:30 – 16:30 Ovaru Hoydalar
Unlock Endless Visualization Possibilities with SVGs
Power BI has supported the use of SVG for some time. However, the fact that we use them only as icons or images underestimates their possibilities.
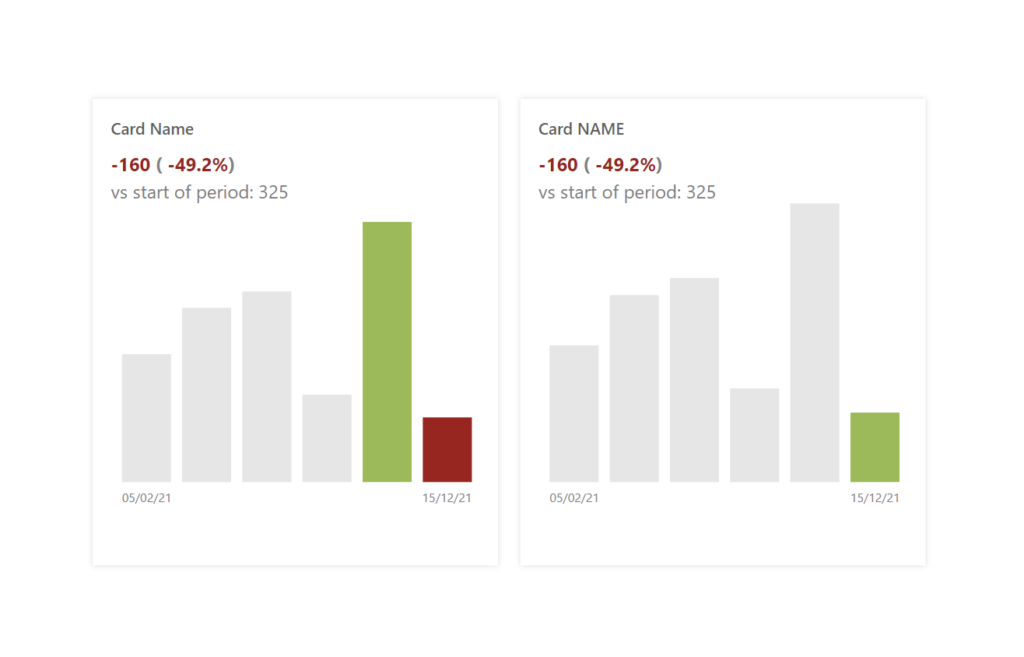
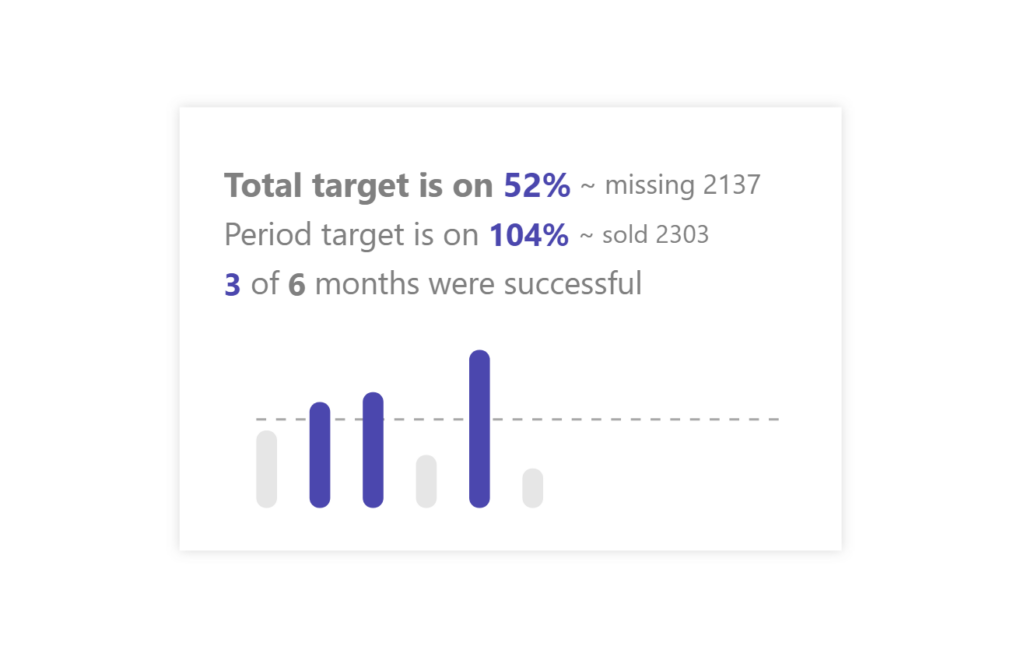
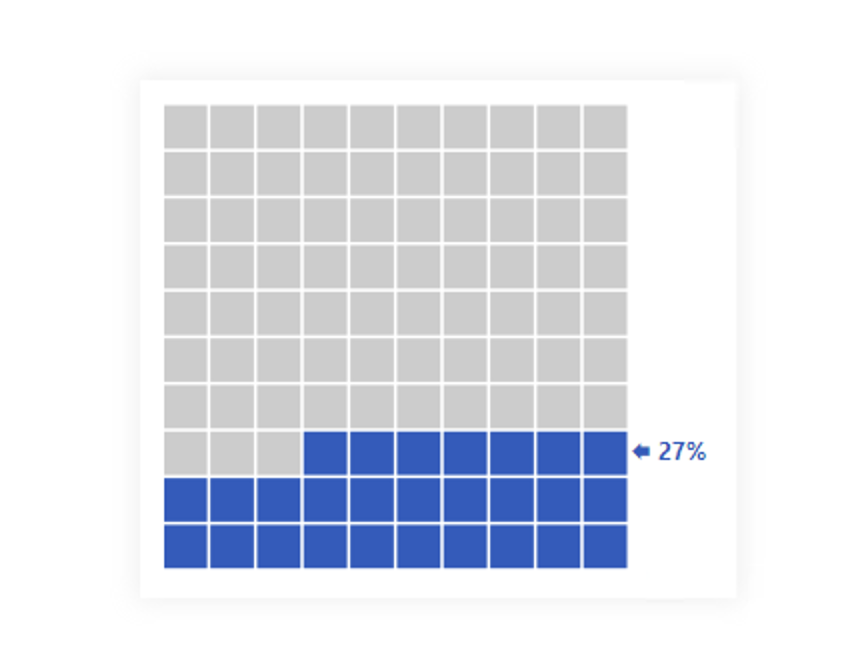
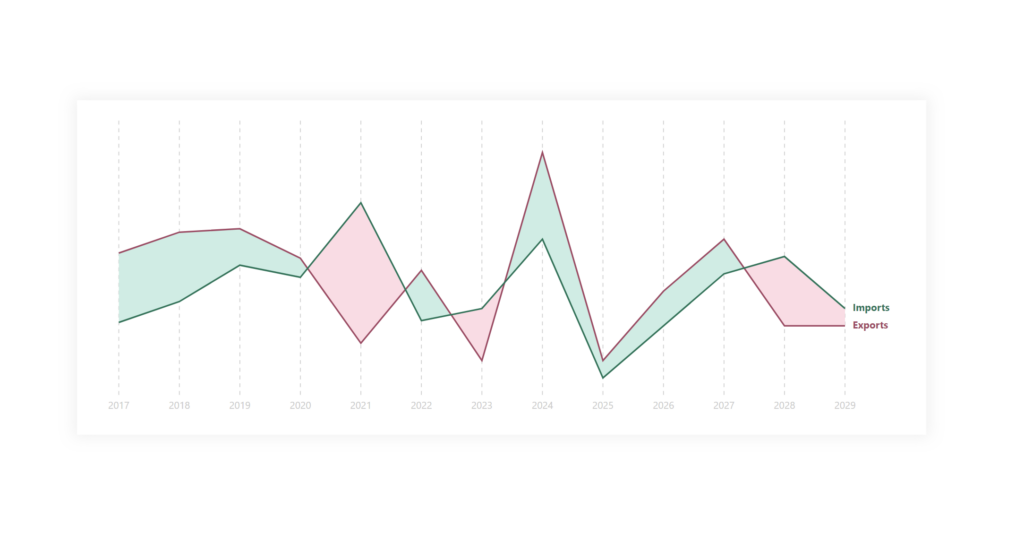
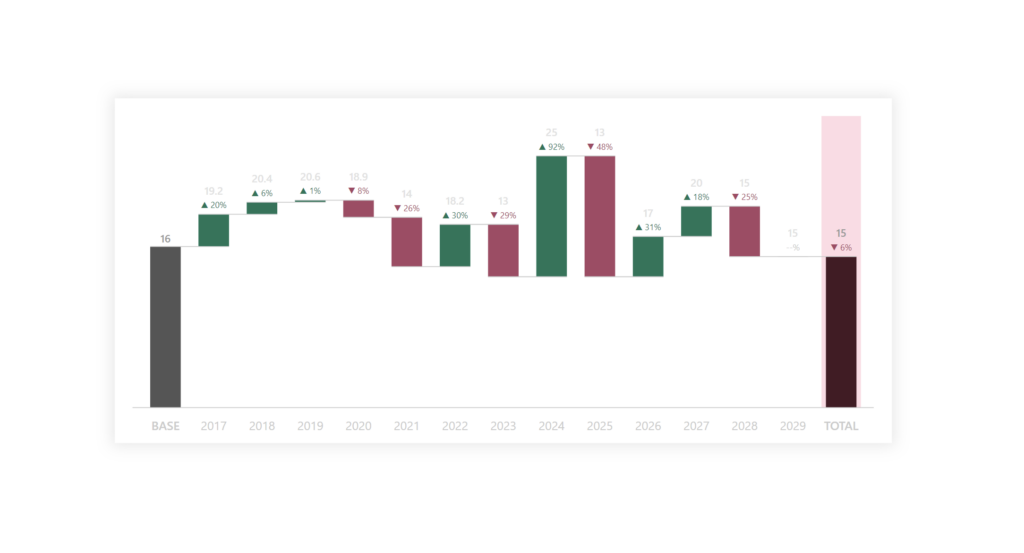
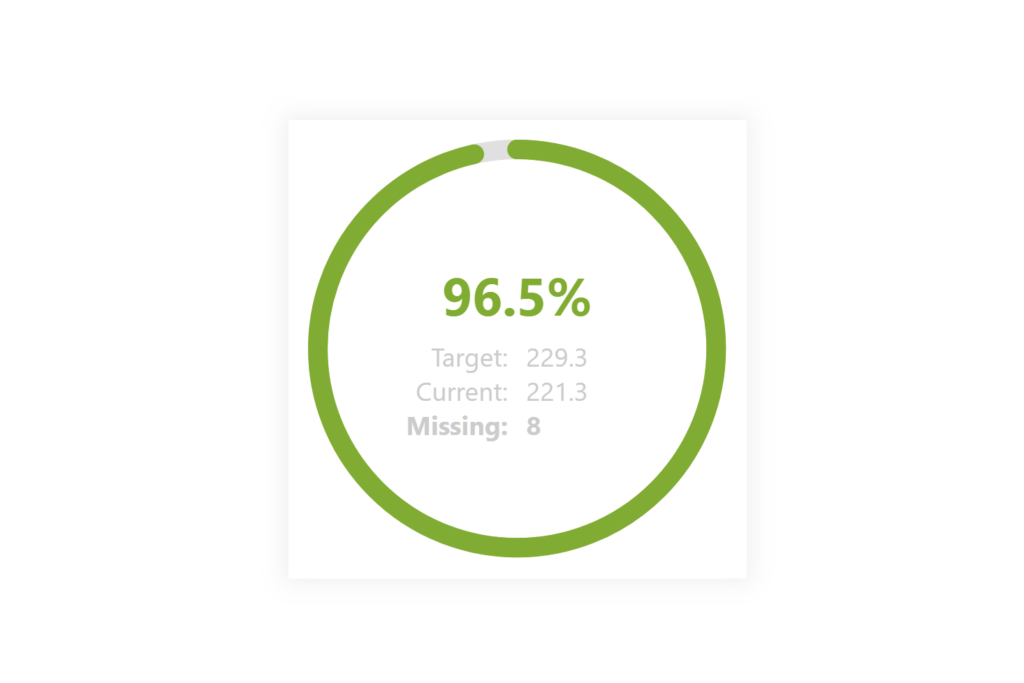
Their real contribution is noticeable only in visuals such as Matrix, Table, or New Card visual. There, they can completely overturn the rules of the visual game that we know classically from Power BI.
Why? Because we usually focus on colors, which many people perceive differently. What if we could adjust, for example, the width of a column and thereby highlight it, adjust the boldness of a word in the text, or even dynamically reduce a part of the text to make the message stand out?
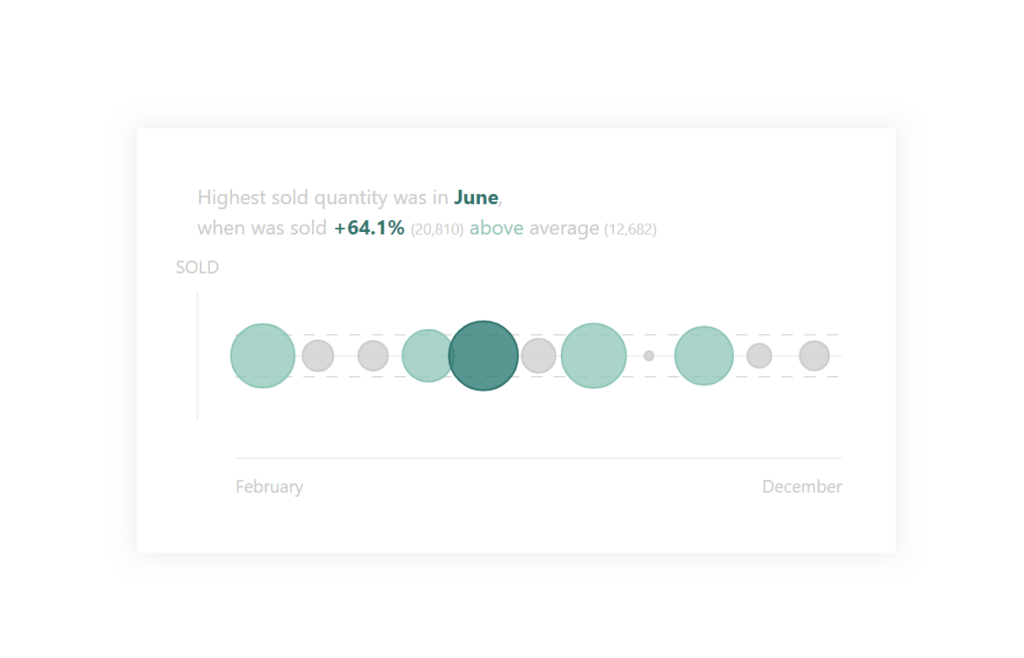
That is the potential of SVGs inside Power BI. That’s how we can use more data storytelling principles. But this is not where they end. Thanks to integration with other MSFT tools, you can send them even to the user‘s chat in Teams!
This full-day workshop will cover essential elements of SVG to Visual Studio Code Extensions in creating them. All SVG that we will create together we will also rewrite into DAX generators to be able to use them directly in your visuals or even further.

Štěpán Rešl

Power BI MVP
Managing partner & Lead technical consultant
I am a data lover, especially in the ecosystem of Microsoft tools. I primarily focus on Power BI, Azure Synapse, and Azure SQL. In general, I follow a very simple motto.
“Don´t say it cannot be done, or someone who doesn´t know it will come and do it.”
I am a co-founder and a Lead Technical Consultant at DataBrothers. We are Power BI experts and consultants with a focus on data analysis, reporting, and training in Power BI. We work with our clients across the globe on developing custom solutions and training their users on all levels (from business to development).